2022: Dynamic Decentralization Domains for the Internet of Things
From
Experiment publicly available at https://github.com/cric96/experiment-2022-ieee-decentralised-system
Abstract
The Internet of Things and edge computing are fostering a future of ecosystems hosting complex decentralized computations, deeply integrated with our very dynamic environments. Digitalized buildings, communities of people, and cities will be the next-generation “hardware and platform”, counting myriads of interconnected devices, on top of which intrinsically-distributed computational processes will run and self-organize. They will spontaneously spawn, diffuse to pertinent logical/physical regions, cooperate and compete, opportunistically summon required resources, collect and analyze data, compute results, trigger distributed actions, and eventually decay. How would a programming model for such ecosystems look like? Based on research findings on self-adaptive/self-organizing systems, the paper proposes design abstractions based on “dynamic decentralization domains”: regions of space opportunistically formed to support situated recognition and action. We embody the approach into a Scala application program interface (API) enacting distributed execution and show its applicability in a case study of environmental monitoring.
Experiment description
In the simulation presented in the paper we want to monitor the rain intensity to pre-alert the public safety organizations close to areas at a risk of floods.
The tracked phenomenon is spatially and temporally hard to predict with fine-enough grain (data from the NOAA1 has, at best, zip-code gran- ularity): at a single-city level, we could perform better by promptly reacting to specialized sensors readings. However, the information provided by individual sensors is too fragile, as the risk depends on the rain intensity in surroundings and not just on the specific spot (e.g., coastal zones with a steep elevation profiles could suffer floods even with light rain, if the close-by higher-altitude zone is being hit hard). Pre-defining areas (using pre-existing altimetric and structural knowledge) helps, but this strategy misses out on essential information: how the underlying phenomenon is behaving. Indeed, areas should be formed ad-hoc considering the city structure and rain distribution, and leveraged to perform on-the-fly situation recognition and response. This approach is practical whenever there are phenomena with non-strictly-local effects, irregularly shaped in space, and/or hard-to-predict a fine grain.
For the simulation of rain intensity, we used open data of Toronto, featuring 50 water gauges samples taken in 2021. To stress-test our proposed approach with a denser network of devices, we added 300 simulated gauges, randomly positioned, whose data is interpolated from the values of the surrounding real devices. We selected the rain event that occurred on 2021-09-07, the heaviest in the available data. We used data from OpenStreetMap to position 24 fire stations In the experiment, devices compute their programs unsynchronized at a frequency of 1Hz. We define a simple metric for the actual risk of a location as the quotient of the local rain intensity on the local altitude (namely, the rainier and the lower the position, the higher the risk); we run an oracle measuring it with a fine grain across the city at each instant. As performance measure, we count how many alerts get generated and how many stations they reach. Additional gauges position and device timing drift are randomized.
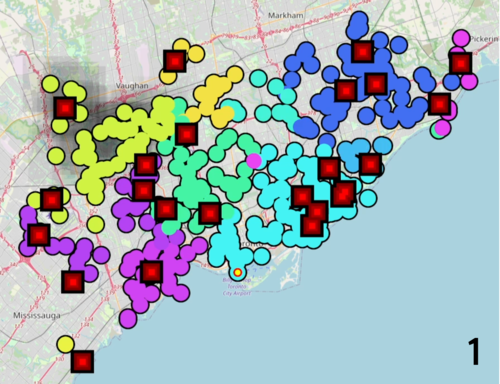
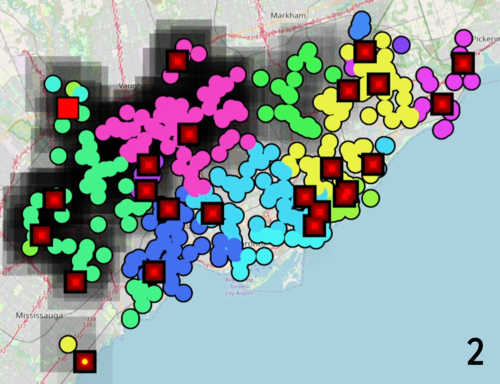
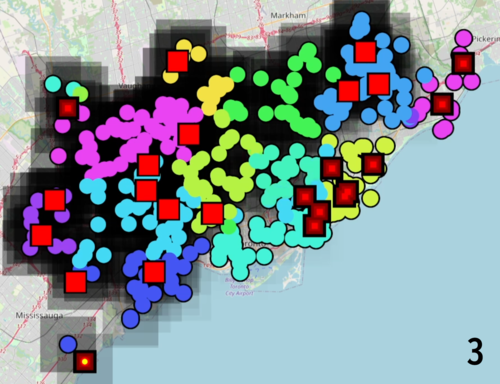
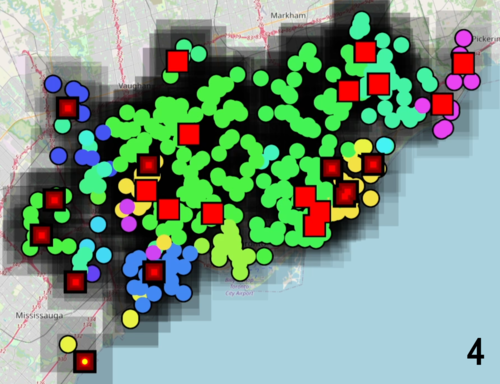
Snapshots
Darker shadows indicate heavier rain. Black squares with a small red dot are unalerted fire stations, when at least an alert reaches them, their dot changes to a large red square. Circles represent gauges; their colors map the region they are subject to when measuring rainfall intensity.